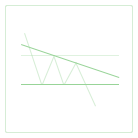
The Descending Triangle is defined by two lines: a horizontal support line running through bottoms and a downtrend line drawn through the peaks. While two peaks belonging to the same trendline would suffice for pattern recognition, the pattern might prove more reliable when there are more. This describes perfect conditions for the Descending Triangle formation, which means that overall signal strength is set to maximum. However, this is relatively rare, so, in the majority of cases, the support line could have a slight slope or both the trendline and the support line will be pierced by false intrabar breakouts. This could cause some problems as false breakouts might be easily confused with the true ones when, in fact, the price is going to retreat back into the triangle.
Descending Triangles are generally seen as bearish continuation patterns, however, they can be occasionally observed in uptrends, in which case a major trend reversal might be expected. In terms of breakouts, this pattern is also somewhat ambivalent as the escape from the Descending Triangle can happen in both directions. Statistically, downward breakouts are more likely to occur, but upward ones seem to be more reliable. Among the upward breakouts, the most desirable to find are those that happen after a gap. Larger gaps seem to leave less chance for the price to retreat back into the triangle. Note that statistically this rule is only approved for the upward breakouts; for the downward ones, gapping proves to have little to no effect.
In course of pattern formation, volume is most likely to fall.