Description
The Darvas Box study generates Buy and Sell signals based on crossovers of the price plot with two bands. These bands are plotted at High and Low price levels of the bar that is in a certain state. Five states are considered when calculating upper and lower band levels.
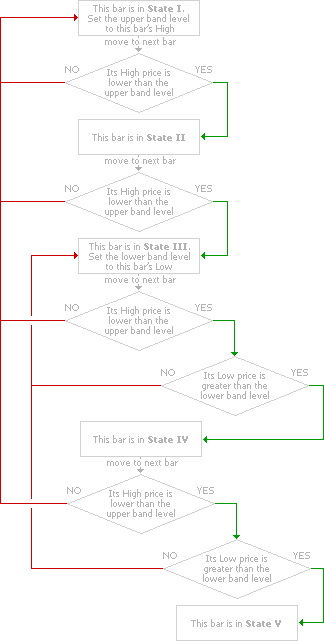
Use the following flowchart to retrace the Darvas Box calculation mechanism. Band levels are calculated on the bar-by-bar basis, starting from the first bar on chart, which is assigned State I.
In state V, both upper and lower bands are plotted from the first bar to the intersection of either band with the price plot. If such an intersection occurs, a Buy or Sell signal is generated. The intersected bar is assigned State I, the bands fracture at the previous bar, and new upper and lower bands are calculated using the intersected bar as the first in the sequence. Buy signals are generated when the upper band is breached, and Sell signals are generated upon intersection with lower band.
Plots
| Plot | Description |
|---|---|
Upper Band
|
The upper band plot. |
Lower Band
|
The lower band plot. |
Buy Signal
|
Boolean plot marking Buy signals. |
Sell Signal
|
Boolean plot marking Sell signals. |
Example*
*For illustrative purposes only. Not a recommendation of a specific security or investment strategy.